.png&w=96&q=75)
Massachusetts Institute of Technology
The Massachusetts Institute of Technology is a private research university in Cambridge, Massachusetts, and the most influential science-and-engineering institution in the world. Admission is extraordinarily competitive — MIT admitted about 4.6% of more than 29,000 applicants, and enrolled first-years posted middle-50% SAT scores of 1520–1570 and ACT scores of 34–35. MIT reinstated its standardized testing requirement and meets 100% of demonstrated financial need, with computer science and engineering accounting for well over half of all degrees. The figures below are drawn directly from MIT's official Common Data Set.
See how MIT compares
Pick up to two rivals — or search any school.
MIT admissions statistics
Acceptance rate
Total applicants, admitted students, and enrolled students for the most recent admission cycle.
Early action
MIT offers non-binding Early Action — an earlier decision with no commitment to enroll.
Standardized tests
MIT requires standardized test scores for all applicants.
SAT Accepted?
ACT Accepted?
Test Optional?
SAT Scores
ACT Scores
MIT application deadlines — Fall 2027
Last checked August 19, 2026. If you are applying, you should verify deadlines on MIT’s site.
- Early ActionNovember 1, 2026
- Regular DecisionJanuary 4, 2027
Source: MIT’s admissions dates page · checked August 19, 2026
MIT supplemental essays — 2026-2027 cycle
What field of study appeals to you the most right now? (Note: Applicants select from a drop-down list.) Reflect on what has led you to this interest.
While some reach their goals following well-trodden paths, others blaze their own trails achieving the unexpected. In what ways have you done something different than what was expected in your educational journey?
Reflect on how your personal and academic experiences have influenced the types of problems you would want to tackle with an MIT education, and who you would like to work on those problems with.
How did you manage a situation or challenge that you didn't expect? What did you learn from it?
What do you do just for fun?
Who is someone you admire, whether you know them personally or look up to them from afar? Tell us why.
What's a topic, academic or non-academic, that you could talk about for hours?
MIT values both "generalists" with varied interests and "specialists" who focus deeply on one or a few passions. Which do you think best describes you, and why?
Writing your MIT application essay?
Paste your draft and get specific, line-by-line feedback on what is and isn't landing — scored against the rubrics admissions readers use.
Admissions factors
How MIT weighs each part of your application.
Rigor of High School Record
Academic GPA
Standardized Test Scores
Application Essay
Recommendations
Extracurricular Activities
Character / Personal Qualities
Talent / Ability
First Generation
Level of Applicant's Interest
Class Rank
Volunteer Work
Work Experience
Geographical Residence
State Residency
Alumni Relation
Racial / Ethnic Status
Religious Affiliation
Cost of attendance
Estimated full-time annual cost from MIT's Common Data Set.
Private universities charge the same tuition regardless of state residency.
What families actually pay
Average net price — what was left to pay after grant aid — for students receiving federal financial aid.
Source: College Scorecard (2026)
Financial aid
Need-based aid statistics for full-time first-year students.
Frequently asked questions about MIT admissions
Very hard. MIT admitted about 4.6% of applicants in the most recent cycle — roughly 1,334 offers out of more than 29,000 applicants, with about 1,152 enrolling. Admitted students cluster at the very top academically: the middle 50% of enrolled first-years scored 1520–1570 on the SAT and 34–35 on the ACT, and about 99% of submitted SAT scores landed in the 1400–1600 range.
MIT requires the SAT or ACT — it is not test-optional. Among enrolled first-years, the middle 50% scored 1520–1570 on the SAT (median 1550) and 34–35 on the ACT (median 35). A 1520 sits at the 25th percentile, so it is on the lower edge of the admitted range; nearly 99% of submitted SAT scores were 1400 or above.
MIT does not publish an average high school GPA in its Common Data Set, so there is no official GPA cutoff to point to. In its holistic review, MIT rates academic GPA and the rigor of your high school record as important factors — especially strength in math and science coursework — alongside test scores, essays, and recommendations.
MIT offers nonbinding Early Action, not Early Decision. Its Early Action is also non-restrictive, so applying early to MIT does not bar you from applying to other schools, and because it is nonbinding you are not committed to enroll if admitted. MIT reports a single overall admit rate of about 4.6%; it does not break out a separate early-round funnel in its Common Data Set.
In MIT's own admissions review, character and personal qualities is the single factor rated 'very important.' A large group of factors are rated 'important,' including rigor of your high school record, academic GPA, standardized test scores, the application essay, recommendations, extracurricular activities, and talent or ability. Class rank, work experience, and first-generation status are 'considered,' while alumni relation and demonstrated interest are not considered at all.
Tuition and required fees run about $67,140 per year before housing and food, with on-campus housing and meals adding roughly $22,194. MIT meets 100% of demonstrated financial need: about 57% of students receive need-based grant aid, and the average aid package is around $72,593 — larger than tuition and fees alone.
Computer science is the single most popular field at about 33% of bachelor's degrees, followed closely by engineering at 24%. Mathematics (14%), interdisciplinary programs (10%), and the physical sciences (7%) round out the most common areas — meaning computer science and engineering together account for well over half of all degrees.
MIT is small for a major research university, with about 4,561 undergraduates and an 8:1 student-to-faculty ratio. It is also highly residential and stable: roughly 100% of first-years live on campus, the first-year retention rate is about 99%, and the six-year graduation rate is about 96%.
Popular majors
Bachelor's degrees awarded in the past year by academic major.
Student-faculty ratio
The number of students for every one faculty member, indicating the average level of access students have to instructional staff.
Student outcomes
Median yearly income of former students who received federal aid, across every major, measured four years after graduating (2017–18 and 2018–19 graduates, earnings measured 2022–2023). Debt covers federal loans of students who completed.
Source: College Scorecard (2026)
Programs
MIT’s most popular programs and median pay after graduation. Income data from the US Department of Education’s College Scorecard.
323 degrees (2023-24)
~$225kmedian pay, 4 yrs after graduation~$11k median debt- Mechanical EngineeringABET accreditedMechanical Engineering (Course 2) is accredited by ABET, the accreditor for engineering, computing, and applied science programs.
104 degrees (2023-24)
~$132kmedian pay, 4 yrs after graduation~$12k median debt - Mathematics
98 degrees (2023-24)
~$175kmedian pay, 4 yrs after graduation~$10k median debt - Electrical EngineeringABET accreditedElectrical Engineering and Computer Science (Course 6-2) is accredited by ABET, the accreditor for engineering, computing, and applied science programs.
58 degrees (2023-24)
~$161kmedian pay, 4 yrs after graduation~$11k median debt - Aerospace EngineeringABET accreditedAerospace Engineering (Course 16) is accredited by ABET, the accreditor for engineering, computing, and applied science programs.
55 degrees (2023-24)
~$115kmedian pay, 4 yrs after graduation~$18k median debt
Show all 20 programsShow fewer
- Chemical EngineeringABET accreditedChemical Engineering (Course 10) is accredited by ABET, the accreditor for engineering, computing, and applied science programs.
49 degrees (2023-24)
~$122kmedian pay, 4 yrs after graduation~$17k median debt - Physics
49 degrees (2023-24)
~$131kmedian pay, 4 yrs after graduation~$19k median debt - Biomedical EngineeringNot ABET-accredited
48 degrees (2023-24)
~$112kmedian pay, 4 yrs after graduation~$13k median debt - Chemistry
26 degrees (2023-24)
Not publishedmedian pay after graduation - Biology
23 degrees (2023-24)
Not publishedmedian pay after graduation - Computer & Information Sciences
19 degrees (2023-24)
Not publishedmedian pay after graduation - Architecture
7 degrees (2023-24)
Not publishedmedian pay after graduation - Neuroscience
7 degrees (2023-24)
~$48kmedian pay, 1 yr after graduation - Economics
6 degrees (2023-24)
Not publishedmedian pay after graduation - Civil EngineeringNot ABET-accredited
4 degrees (2023-24)
Not publishedmedian pay after graduation - Earth & Geological Sciences
4 degrees (2023-24)
Not publishedmedian pay after graduation - Political Science
4 degrees (2023-24)
Not publishedmedian pay after graduation - Philosophy
2 degrees (2023-24)
Not publishedmedian pay after graduation - General EngineeringABET accreditedEngineering (Course 1-ENG) is accredited by ABET, the accreditor for engineering, computing, and applied science programs.
Degrees conferred not published (2023-24)
Not publishedmedian pay after graduation - Computer EngineeringABET accreditedComputer Science and Engineering (Course 6-3) is accredited by ABET, the accreditor for engineering, computing, and applied science programs.
Degrees conferred not published (2023-24)
Not publishedmedian pay after graduation
Median pay data is measured from graduates who received federal student aid.
Source: College Scorecard (2026) · IPEDS (2023-24) · ABET
Campus life
On-campus housing and Greek life participation rates.
Place
How the federal government classifies the area around the campus, and what a normal year of weather looks like there.
Average temperature
Monthly high and low, °FThirty-year averages, measured at the nearest weather station rather than on campus — they describe the area, not the campus.
Source: IPEDS (HD2024) · NOAA 1991–2020 U.S. Climate Normals, BOSTON LOGAN INTL AP, MA US station, 4.2 mi from campus
Enrollment by gender
Student diversity
Racial and ethnic breakdown of enrolled undergraduate students.
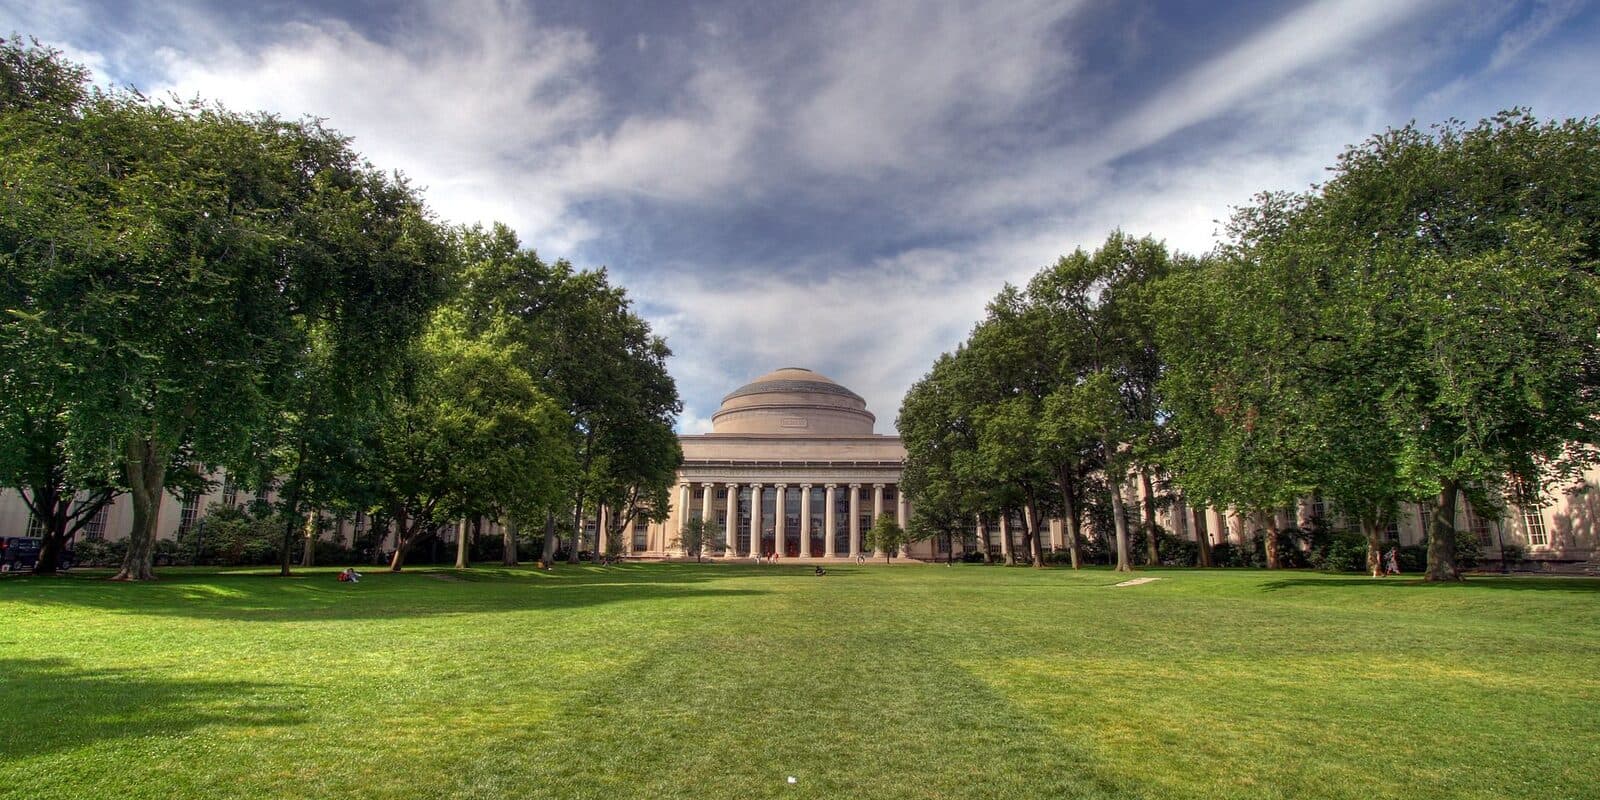
Source: Massachusetts Institute of Technology Common Data Set 2025-2026. Figures transcribed 2026-08-20. Esslo aggregates publicly reported data and is not affiliated with MIT. Banner photo by Madcoverboy, via Wikimedia Commons (CC BY-SA 3.0). Cite this page as: Esslo College Explorer, “Massachusetts Institute of Technology admissions statistics, transcribed from the 2025-2026 Common Data Set,” https://www.esslo.org/colleges/mit (retrieved 2026-08-20).