
Rochester Institute of Technology
Rochester Institute of Technology is a private, coeducational university in Rochester, New York, enrolling about 14,100 undergraduates in a mix of computing, engineering, arts and design programs. RIT admitted about 71.1% of more than 31,500 first-year applicants for its most recent class, and enrolled first-years averaged a 3.90 high school GPA with middle-50% SAT scores of 1310–1440. Computer and information sciences (25%) and engineering (24%) together account for about half of bachelor's degrees. RIT offers Early Decision I and II and Early Action, and it reports meeting an average of 92% of need for first-years with need who received aid.
See how RIT compares
Pick up to two rivals — or search any school.
RIT admissions statistics
Acceptance rate
Total applicants, admitted students, and enrolled students for the most recent admission cycle.
Early decision
RIT offers binding Early Decision. Applying early can meaningfully change your odds — but ED commits you to enroll if admitted.
Admit rate by application plan
% admitted~1.0× higher admit rate applying early.
Standardized tests
RIT is currently test-optional — you may apply without submitting scores.
SAT Accepted?
ACT Accepted?
Test Optional?
SAT Scores
ACT Scores
RIT application deadlines — Fall 2027
Last checked November 19, 2026. Check the dates on RIT’s site before you apply.
- Early DecisionNovember 1, 2026
- Early ActionNovember 1, 2026
- Early Decision IIJanuary 1, 2027
- Regular DecisionJanuary 15, 2027
Source: RIT’s admissions dates page · checked November 19, 2026
RIT supplemental essays — 2026-2027 cycle
Please provide a brief statement about why you are interested in being considered for the RIT Honors Program.
Is Interpreting the Career for Me? Based on the question posed, share with us why you will make an outstanding sign language interpreter. Include any relevant information about past work or personal experiences that demonstrate your aptitude for the physical and intellectual demands of a sign language interpreter. Additionally, describe your experience with American Sign Language including course work, family and social interaction.
Please provide a brief statement about why you are interested in being considered for the RIT Honors Program.
Is Interpreting the Career for Me? Based on the question posed, share with us why you will make an outstanding sign language interpreter. Include any relevant information about past work or personal experiences that demonstrate your aptitude for the physical and intellectual demands of a sign language interpreter. Additionally, describe your experience with American Sign Language including course work, family and social interaction.
Writing your RIT application essay?
Paste your draft and get specific, line-by-line feedback on what is and isn't landing — scored against the rubrics admissions readers use.
Class rank
Where RIT's enrolled first-years placed in their high school graduating class.
Based on the 39% of enrolled students who reported a class rank. RIT does not publish an average GPA.
Admissions factors
How RIT weighs each part of your application.
Rigor of High School Record
Academic GPA
Standardized Test Scores
Application Essay
Recommendations
Extracurricular Activities
Character / Personal Qualities
Talent / Ability
First Generation
Level of Applicant's Interest
Class Rank
Volunteer Work
Work Experience
Geographical Residence
State Residency
Alumni Relation
Racial / Ethnic Status
Religious Affiliation
Cost of attendance
Estimated full-time annual cost from RIT's Common Data Set.
Private universities charge the same tuition regardless of state residency.
What families actually pay
Average net price — what was left to pay after grant aid — for students receiving federal financial aid.
Source: College Scorecard (2026)
Financial aid
Need-based aid statistics for full-time first-year students.
Frequently asked questions about RIT admissions
RIT admitted about 71.1% of applicants in the most recent cycle, or 22,439 of 31,565, with 2,959 first-years enrolling. The enrolled class is strong academically, averaging a 3.90 high school GPA, and rigor of the high school record and GPA are both rated very important.
Enrolled first-years at RIT average a 3.90 high school GPA, and 42% of the class reported a 4.0. RIT rates academic GPA and the rigor of the high school record as very important, and 40% of first-years who reported a class rank were in the top tenth.
No. RIT's CDS marks the SAT or ACT as not required for admission but considered if submitted, and 41% of enrolled first-years submitted an SAT and 8% an ACT. Submitters scored 1310–1440 in the middle 50% on the SAT and 30–34 on the ACT.
A 1380 equals the median SAT among RIT first-years who submitted scores, where the middle 50% scored 1310–1440. About 42% of submitters scored 1400 or higher, so a 1380 sits just below that top group.
RIT admitted 1,028 of 1,405 Early Decision applicants, or about 73%, compared with 71.1% overall. RIT offers two binding Early Decision rounds and a nonbinding Early Action plan.
Tuition and required fees run $64,608 per year, with food and housing adding $17,370. Among first-years, 72% received need-based scholarship or grant aid, and students with need who received aid averaged a $64,823 package that met 92% of need on average.
Computer and information sciences is the largest field at about 25% of bachelor's degrees, followed by engineering at 24% and visual and performing arts at 10%. Business accounts for 7%, with engineering technologies and the biological sciences at 5% each.
RIT rates the application essay as important, in the same tier as class rank, test scores and recommendations. Academic GPA and the rigor of the high school record are rated very important, so the essay supports the academic record rather than replacing it.
Esslo gives free line-by-line feedback on your draft. Try it now
Popular majors
Bachelor's degrees awarded in the past year by academic major.
Student-faculty ratio
The number of students for every one faculty member, indicating the average level of access students have to instructional staff.
Student outcomes
Median yearly income of former students who received federal aid, across every major, measured four years after graduating (2017–18 and 2018–19 graduates, earnings measured 2022–2023). Debt covers federal loans of students who completed.
Source: College Scorecard (2026)
Programs
RIT’s most popular programs and median pay after graduation. Income data from the US Department of Education’s College Scorecard.
- Computer ScienceABET accreditedComputer Science is accredited by ABET, the accreditor for engineering, computing, and applied science programs.
208 degrees (2023-24)
~$136kmedian pay, 4 yrs after graduation~$24k median debt - Design
172 degrees (2023-24)
~$52kmedian pay, 4 yrs after graduation~$27k median debt - Mechanical EngineeringABET accreditedMechanical Engineering is accredited by ABET, the accreditor for engineering, computing, and applied science programs.
164 degrees (2023-24)
~$93kmedian pay, 4 yrs after graduation~$24k median debt - Computer EngineeringABET accreditedComputer Engineering is accredited by ABET, the accreditor for engineering, computing, and applied science programs.
159 degrees (2023-24)
~$123kmedian pay, 4 yrs after graduation~$27k median debt - Film & Photography
149 degrees (2023-24)
~$53kmedian pay, 4 yrs after graduation~$27k median debt
Show all 40 programsShow fewer
- Electrical EngineeringABET accreditedElectrical Engineering is accredited by ABET, the accreditor for engineering, computing, and applied science programs.
100 degrees (2023-24)
~$87kmedian pay, 1 yr after graduation~$26k median debt - Biology
73 degrees (2023-24)
~$69kmedian pay, 4 yrs after graduation~$23k median debt - Computer & Information Sciences
65 degrees (2023-24)
~$100kmedian pay, 4 yrs after graduation~$24k median debt - Biomedical EngineeringABET accreditedBiomedical Engineering is accredited by ABET, the accreditor for engineering, computing, and applied science programs.
54 degrees (2023-24)
~$94kmedian pay, 4 yrs after graduation~$27k median debt - Management Information Systems
50 degrees (2023-24)
~$95kmedian pay, 4 yrs after graduation~$24k median debt - Radio, TV & Digital Media
43 degrees (2023-24)
~$91kmedian pay, 4 yrs after graduation~$26k median debt - Chemical EngineeringABET accreditedChemical Engineering is accredited by ABET, the accreditor for engineering, computing, and applied science programs.
37 degrees (2023-24)
~$95kmedian pay, 4 yrs after graduation~$27k median debt - Business Administration & Management
35 degrees (2023-24)
~$69kmedian pay, 4 yrs after graduation~$23k median debt - Psychology
31 degrees (2023-24)
~$52kmedian pay, 4 yrs after graduation~$23k median debt - Physics
30 degrees (2023-24)
~$75kmedian pay, 4 yrs after graduation~$27k median debt - Applied Mathematics
26 degrees (2023-24)
~$76kmedian pay, 4 yrs after graduation~$24k median debt - Finance
26 degrees (2023-24)
~$72kmedian pay, 4 yrs after graduation~$24k median debt - Criminal Justice & Criminology
21 degrees (2023-24)
~$53kmedian pay, 4 yrs after graduation~$20k median debt - Industrial EngineeringABET accreditedIndustrial Engineering is accredited by ABET, the accreditor for engineering, computing, and applied science programs.
20 degrees (2023-24)
~$105kmedian pay, 4 yrs after graduation~$27k median debt - Accounting
19 degrees (2023-24)
~$73kmedian pay, 4 yrs after graduation~$27k median debt - Environmental Science & Natural Resources
18 degrees (2023-24)
Not publishedmedian pay after graduation - Biochemistry & Molecular Biology
18 degrees (2023-24)
Not publishedmedian pay after graduation~$25k median debt - Chemistry
11 degrees (2023-24)
~$69kmedian pay, 4 yrs after graduation~$27k median debt - Political Science
9 degrees (2023-24)
Not publishedmedian pay after graduation - Kinesiology & Exercise Science
8 degrees (2023-24)
Not publishedmedian pay after graduation - Fine & Studio Arts
8 degrees (2023-24)
Not publishedmedian pay after graduation - Communication & Media Studies
7 degrees (2023-24)
Not publishedmedian pay after graduation - Economics
7 degrees (2023-24)
Not publishedmedian pay after graduation - Hospitality Management
7 degrees (2023-24)
~$51kmedian pay, 4 yrs after graduation - English
5 degrees (2023-24)
Not publishedmedian pay after graduation - Nutrition Sciences
5 degrees (2023-24)
Not publishedmedian pay after graduation - Public Relations & Advertising
4 degrees (2023-24)
~$58kmedian pay, 4 yrs after graduation - Linguistics & Language Studies
4 degrees (2023-24)
Not publishedmedian pay after graduation - History
3 degrees (2023-24)
Not publishedmedian pay after graduation - International Relations & Global Studies
3 degrees (2023-24)
Not publishedmedian pay after graduation - International Business
3 degrees (2023-24)
Not publishedmedian pay after graduation - Public Policy
2 degrees (2023-24)
Not publishedmedian pay after graduation - Marketing
2 degrees (2023-24)
Not publishedmedian pay after graduation - Ethnic, Gender & Cultural Studies
1 degrees (2023-24)
Not publishedmedian pay after graduation - Journalism
1 degrees (2023-24)
Not publishedmedian pay after graduation
Median pay data is measured from graduates who received federal student aid.
Source: College Scorecard (2026) · IPEDS (2023-24) · ABET
Campus life
On-campus housing and Greek life participation rates.
Place
How the federal government classifies the area around the campus, and what a normal year of weather looks like there.
Average temperature
Monthly high and low, °FThirty-year averages, measured at the nearest weather station rather than on campus — they describe the area, not the campus.
Source: IPEDS (HD2024) · NOAA 1991–2020 U.S. Climate Normals, ROCHESTER GTR INTL AP, NY US station, 2.3 mi from campus
Enrollment by gender
Student diversity
Racial and ethnic breakdown of enrolled undergraduate students.
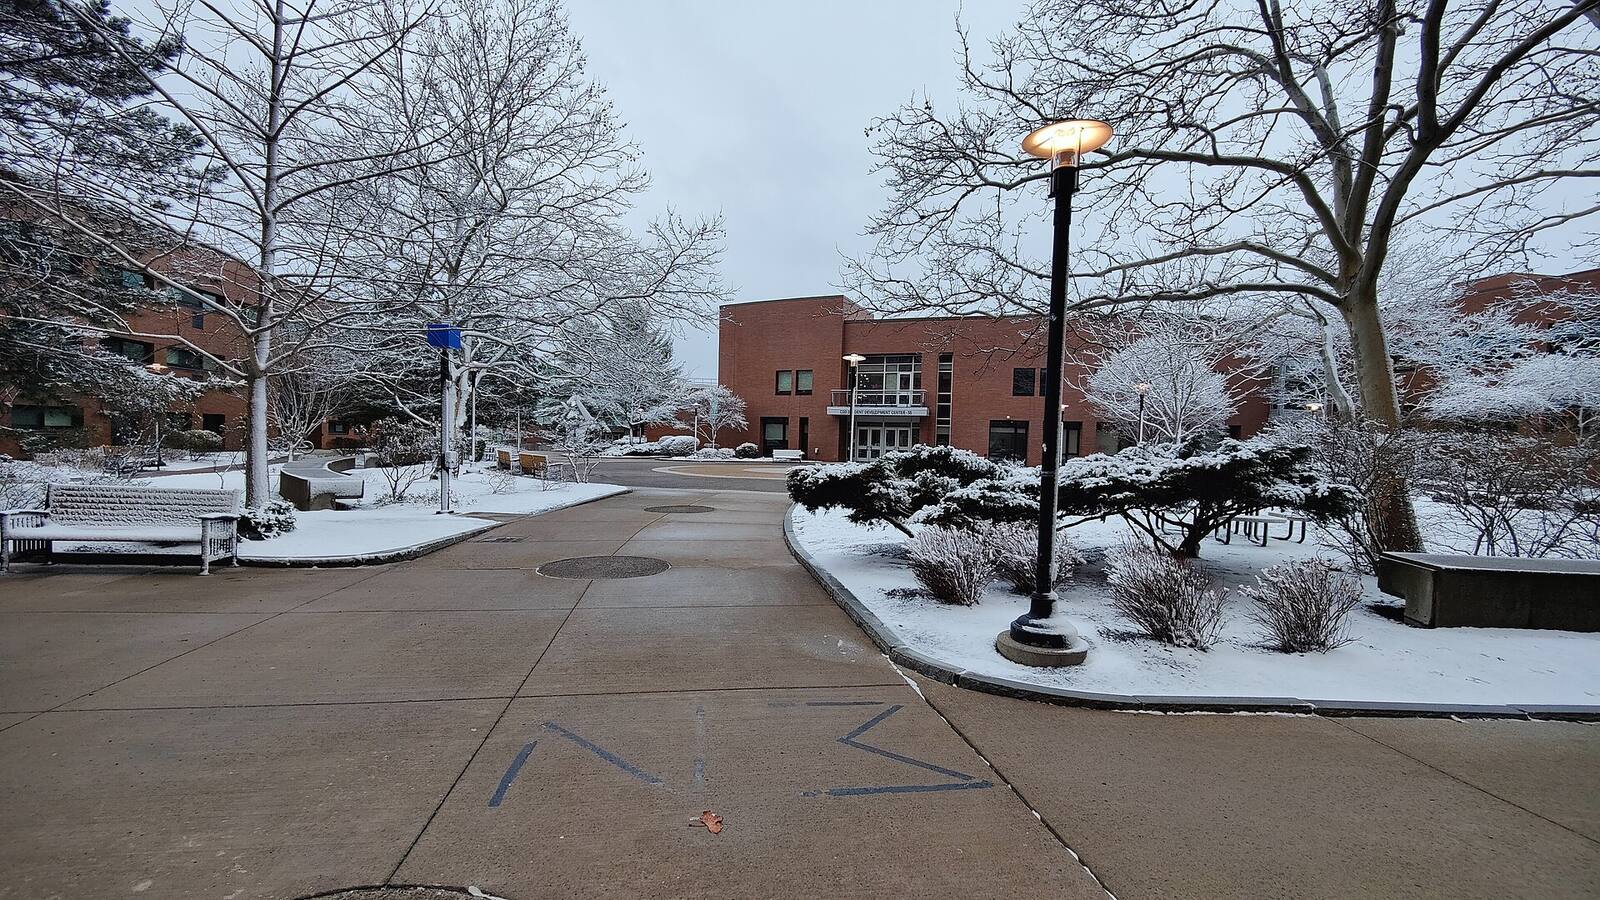
Source: Rochester Institute of Technology Common Data Set 2025-2026. Figures transcribed 2026-11-19. Esslo aggregates publicly reported data and is not affiliated with RIT. Banner photo by Catsup31, via Wikimedia Commons (CC0 1.0). Cite this page as: Esslo College Explorer, “Rochester Institute of Technology admissions statistics, transcribed from the 2025-2026 Common Data Set,” https://www.esslo.org/colleges/rit (retrieved 2026-11-19).