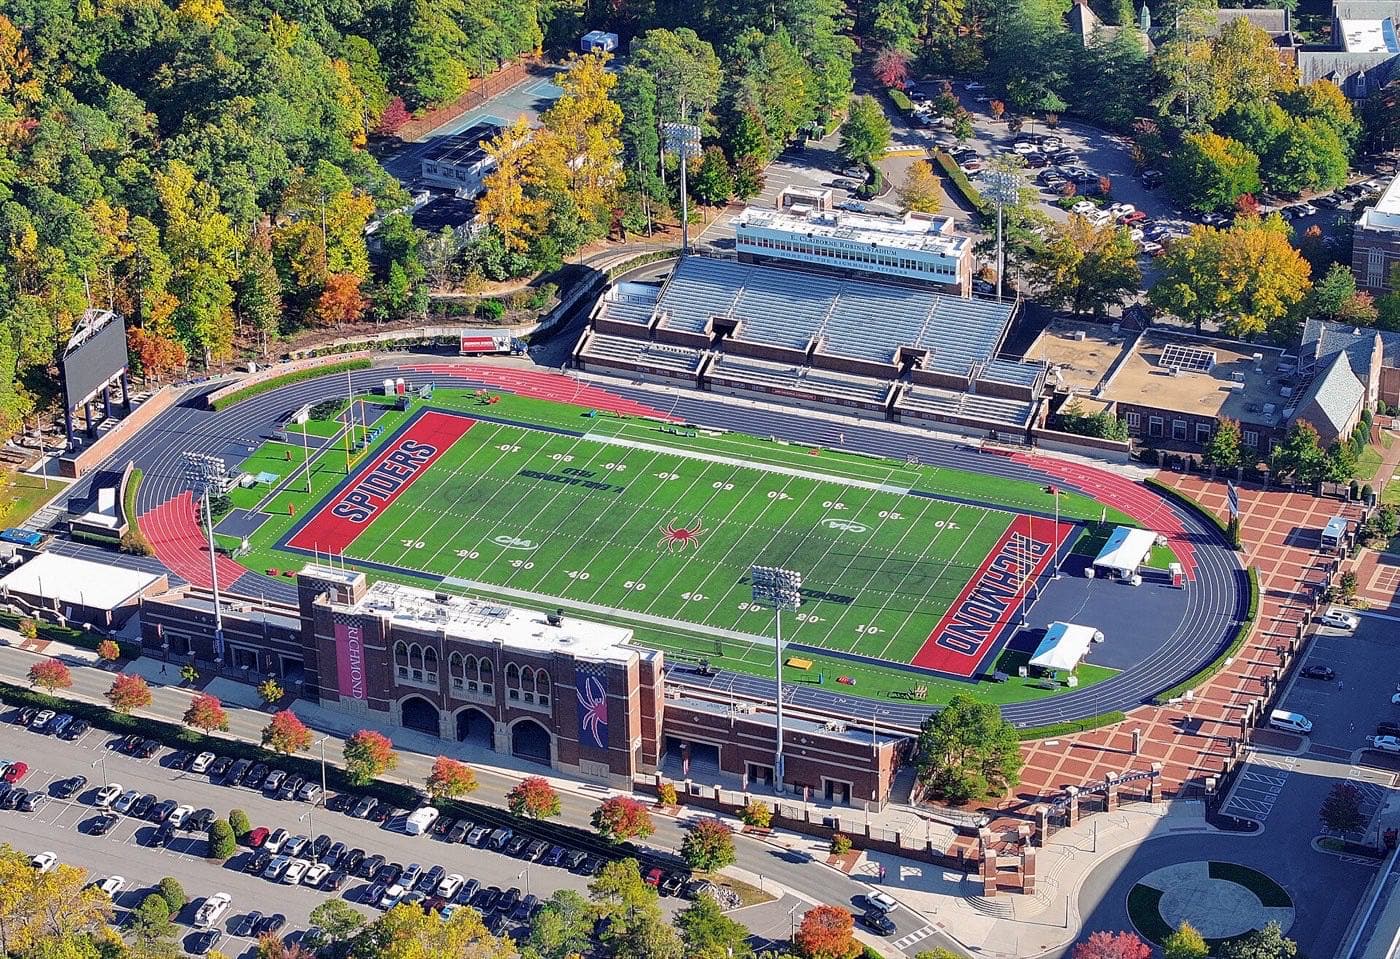

University of Richmond
The University of Richmond runs a liberal-arts college, a top-25 undergraduate business school, and the country's first school of leadership studies across one wooded campus of roughly 3,000 undergraduates. That scale buys a 7-to-1 student-faculty ratio, among the lowest of any national university. Admission has tightened to about 22.2% of some 16,560 applicants, and enrolled first-years carry an average 3.81 GPA with middle-50% SATs of 1420 to 1490. Richmond also meets essentially all demonstrated financial need, averaging 99.5%, which softens a $70,725 sticker price for families who qualify.
See how Richmond compares
Pick up to two rivals — or search any school.
Richmond admissions statistics
Acceptance rate
Total applicants, admitted students, and enrolled students for the most recent admission cycle.
Early decision
Richmond offers binding Early Decision. Applying early can meaningfully change your odds — but ED commits you to enroll if admitted.
Admit rate by application plan
% admitted~1.7× higher admit rate applying early.
Standardized tests
Richmond is currently test-optional — you may apply without submitting scores.
SAT Accepted?
ACT Accepted?
Test Optional?
SAT Scores
ACT Scores
Richmond supplemental essays — 2026-2027 cycle
Prompt 1: Richmond is a community that strives to be relentlessly welcoming. Tell us about a time you made a space better for other people by helping them feel welcome, heard, included, or supported.
Prompt 2: Richmond students turn ideas into actions. Tell us about a time you learned by doing, making, building, testing, helping, or leading and what that experience taught you about yourself, the world, or the kind of impact you want to have.
Prompt 3: Richmond's mascot is the Spider. Just as you are unique, this singular mascot represents over 52,680 unique species of spiders. Tell us about the communities, experiences, or ambitions that have shaped you into the unique person you are and how you will make your mark as part of a Spider community.
Writing your Richmond application essay?
Paste your draft and get specific, line-by-line feedback on what is and isn't landing — scored against the rubrics admissions readers use.
Class rank
Where Richmond's enrolled first-years placed in their high school graduating class.
Based on the 20% of enrolled students who reported a class rank. Richmond does not publish an average GPA.
Admissions factors
How Richmond weighs each part of your application.
Rigor of High School Record
Academic GPA
Standardized Test Scores
Application Essay
Recommendations
Extracurricular Activities
Character / Personal Qualities
Talent / Ability
First Generation
Level of Applicant's Interest
Class Rank
Volunteer Work
Work Experience
Geographical Residence
State Residency
Alumni Relation
Racial / Ethnic Status
Religious Affiliation
Cost of attendance
Estimated full-time annual cost from Richmond's Common Data Set.
Private universities charge the same tuition regardless of state residency.
What families actually pay
Average net price — what was left to pay after grant aid — for students receiving federal financial aid.
Source: College Scorecard (2026)
Financial aid
Need-based aid statistics for full-time first-year students.
Frequently asked questions about Richmond admissions
Yes. Richmond admitted about 22.2% of roughly 16,560 applicants for its most recent class, placing it among the more selective liberal-arts-oriented universities in the country. Enrolled first-years averaged a 3.81 GPA, and among the 20% who reported a class rank, 89% stood in the top quarter of their high school class.
Richmond admitted 421 of 1,154 binding Early Decision applicants, an admit rate near 36.5% against roughly 22% overall. That gap makes ED the single largest lever an applicant controls. Richmond runs both ED I and ED II, plus a non-binding Early Action round for students who want an early answer without the commitment.
A 1450 sits squarely inside Richmond's admitted range, just above the 1440 median. The middle 50% of enrolled first-years who submitted scores scored 1420 to 1490, and 85% of submitters landed above 1400. Richmond is test-optional but rates standardized test scores as an important factor, so a score in that band helps rather than merely avoids harm.
No, Richmond is test-optional. Only about 19% of enrolled first-years submitted an SAT and 15% an ACT. Note the wrinkle: unlike many test-optional schools that downgrade scores to 'considered,' Richmond still rates standardized tests as important in its Common Data Set, which means a strong score carries real weight if you choose to send one.
Close to it. Richmond met an average of 99.5% of demonstrated need for aided first-years, and the average first-year aid package came to $66,713 against a $70,725 tuition figure. About 37% of first-years receive need-based scholarship or grant aid, so the students who qualify see most of the sticker price disappear.
Business and marketing lead at about 35% of bachelor's degrees, driven by the Robins School of Business. Social sciences follow at 10%, interdisciplinary programs at 9%, and biological sciences at 8%. Psychology and the health professions each account for roughly 5%, and the Jepson School's leadership studies degree gives Richmond a major almost no peer offers.
Yes. Richmond rates the application essay as an important factor, on par with test scores, recommendations, activities, and personal qualities. Its supplement runs up to 650 words with a choice of prompts, which is unusually long for a supplemental and leaves room for a genuine piece of writing rather than a compressed pitch.
Esslo gives free line-by-line feedback on your draft. Try it now
Small and heavily national: 3,052 undergraduates, with 86% of first-years coming from outside Virginia despite the university's in-state name recognition. The gender split runs 54% women to 46% men, and the 7-to-1 student-faculty ratio means most classes are seminar-sized rather than lecture halls.
Popular majors
Bachelor's degrees awarded in the past year by academic major.
Student-faculty ratio
The number of students for every one faculty member, indicating the average level of access students have to instructional staff.
Student outcomes
Median yearly income of former students who received federal aid, across every major, measured four years after graduating (2017–18 and 2018–19 graduates, earnings measured 2022–2023). Debt covers federal loans of students who completed.
Source: College Scorecard (2026)
Programs
Richmond’s most popular programs and median pay after graduation. Income data from the US Department of Education’s College Scorecard.
- Business Administration & Management
244 degrees (2023-24)
~$104kmedian pay, 4 yrs after graduation~$21k median debt - Biology
51 degrees (2023-24)
~$70kmedian pay, 4 yrs after graduation~$20k median debt - Economics
51 degrees (2023-24)
~$101kmedian pay, 4 yrs after graduation~$23k median debt - Computer & Information Sciences
33 degrees (2023-24)
~$113kmedian pay, 4 yrs after graduation~$25k median debt - Biochemistry & Molecular Biology
32 degrees (2023-24)
~$35kmedian pay, 1 yr after graduation~$23k median debt
Show all 18 programsShow fewer
- Political Science
20 degrees (2023-24)
~$68kmedian pay, 4 yrs after graduation~$23k median debt - Chemistry
17 degrees (2023-24)
~$23kmedian pay, 1 yr after graduation~$20k median debt - English
15 degrees (2023-24)
~$58kmedian pay, 4 yrs after graduation~$23k median debt - Mathematics
13 degrees (2023-24)
Not publishedmedian pay after graduation - Fine & Studio Arts
12 degrees (2023-24)
Not publishedmedian pay after graduation - Environmental Science & Natural Resources
11 degrees (2023-24)
Not publishedmedian pay after graduation - History
11 degrees (2023-24)
Not publishedmedian pay after graduation - Physics
7 degrees (2023-24)
Not publishedmedian pay after graduation - Philosophy
4 degrees (2023-24)
Not publishedmedian pay after graduation - Journalism
3 degrees (2023-24)
~$43kmedian pay, 1 yr after graduation - Music
1 degrees (2023-24)
Not publishedmedian pay after graduation - Area Studies
Degrees conferred not published (2023-24)
~$33kmedian pay, 1 yr after graduation~$19k median debt - Psychology
Degrees conferred not published (2023-24)
~$65kmedian pay, 4 yrs after graduation~$25k median debt
Median pay data is measured from graduates who received federal student aid.
Source: College Scorecard (2026) · IPEDS (2023-24)
Campus life
On-campus housing and Greek life participation rates.
Place
How the federal government classifies the area around the campus, and what a normal year of weather looks like there.
Average temperature
Monthly high and low, °FThirty-year averages, measured at the nearest weather station rather than on campus — they describe the area, not the campus.
Source: IPEDS (HD2024) · NOAA 1991–2020 U.S. Climate Normals, ASHLAND, VA US station, 12.6 mi from campus
Enrollment by gender
Student diversity
Racial and ethnic breakdown of enrolled undergraduate students.
Source: University of Richmond Common Data Set 2025-2026. Figures transcribed 2026-08-19. Esslo aggregates publicly reported data and is not affiliated with Richmond. Banner photo by Quintin Soloviev, via Wikimedia Commons (CC BY 4.0). Cite this page as: Esslo College Explorer, “University of Richmond admissions statistics, transcribed from the 2025-2026 Common Data Set,” https://www.esslo.org/colleges/university-of-richmond (retrieved 2026-08-19).